Altcoin Market Buzz: Golden Cross Signals Potential 2025 Altseason

Crypto enthusiasts are buzzing with excitement as a major technical indicator—the weekly Golden Cross of the 200-day Exponential Moving Average (EMA) and 200-day Simple Moving Average (SMA) for the total altcoin market cap—has just been confirmed. Shared by crypto analyst
@el_crypto_prof on X, this bullish signal is stirring memories of the massive altseason in 2021, hinting that 2025 could be the year altcoins take center stage.
What’s a Golden Cross, and Why It Matters
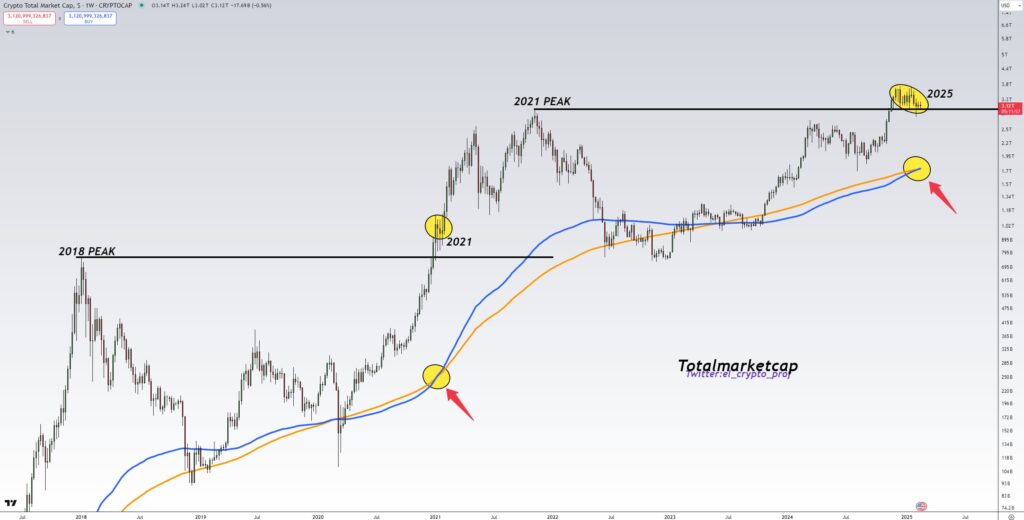
For the uninitiated, a Golden Cross occurs when a shorter-term moving average (like the 50-day or 100-day) crosses above a longer-term moving average (typically the 200-day), signaling a potential upward trend. In this case, the crossover on the total altcoin market cap chart—excluding major players like Bitcoin—marks a historic moment. The chart, shared by
@el_crypto_prof, highlights peaks in 2018, 2021, and now 2025, with yellow markers showing where this signal previously triggered explosive growth, especially in 2021’s altseason.
The post suggests this pattern could foreshadow another significant rally for altcoins, driving speculation across the crypto community. Responses on X ranged from hopeful—“I’m really hoping this is my retirement signal!”—to downright hyped, with one user declaring, “2021’s altseason was just a preview—this one’s gonna hit harder.”
Historical Context and Hype
The 2021 altseason was a landmark period, with altcoins like Ethereum, Solana, and others seeing parabolic gains as Bitcoin’s dominance waned. The Golden Cross, as noted in web resources like dYdX Academy and Controverity, is a widely respected bullish indicator, though it’s not foolproof. The current chart shows the total altcoin market cap trending upward, with the 200-day EMA/SMA crossover aligning with historical patterns that preceded massive price surges.
However, skeptics on X warned of risks, with one commenter sarcastically noting, “Keep leading them to the slaughter—big respect for bringing in the exit liquidity.” This reflects the volatility and potential for “pump and dump” schemes that often accompany such hype.
What’s Next for Altcoins?
While the Golden Cross doesn’t guarantee skyrocketing prices, it’s a signal traders are watching closely. Analysts like those at Controverity suggest 2025 could see altcoins outperform, especially after a period of consolidation. The chart’s yellow markers—pointing to 2018, 2021, and now 2025—suggest a cyclical pattern, fueling optimism that smaller-cap tokens could see significant gains if market momentum builds.
For now, the crypto community is on edge, debating whether this is the start of the next big altseason or just another false dawn. But one thing’s clear: the Golden Cross has put altcoins back in the spotlight.

While beginners might see the Golden Cross as a surefire bull run, seasoned traders know it’s just one piece of the puzzle. The chart’s reliance on the 200-day EMA/SMA crossover ignores broader market sentiment, whale manipulation, or regulatory risks—factors that could derail this rally before it even starts.
 tokens. The image features a blazing Shiba Inu coin surrounded")
 token surging due to a major ETF announcement and upcoming zkEVM upgrade. The image features a glowin")


. The image features a Bitcoin price chart climbing toward")


